With this year’s April version of its product portfolio, Qlik is launching the first synchronized release for its data analytics and data integration platforms. The Qlik Sense analysis platform has also been expanded again – especially in the areas of visualization and dashboards.
The new releases contain some general innovations that are designed to ease the start and use of Qlik Sense for customers. For example, a new Qlik Sense Enterprise package offers a “Only-SaaS” option to make management more flexible and lower the total cost of ownership. Users of QlikView will also be supported in the adoption of Qlik Sense by Qlik’s new “Analytics Modernization Program”. This can be used, for example, to automate the publishing of QlikView apps on the Qlik Sense Enterprise SaaS Hub and facilitate the parallel use of both products.
Improved visualizations, dashboards and pivot tables
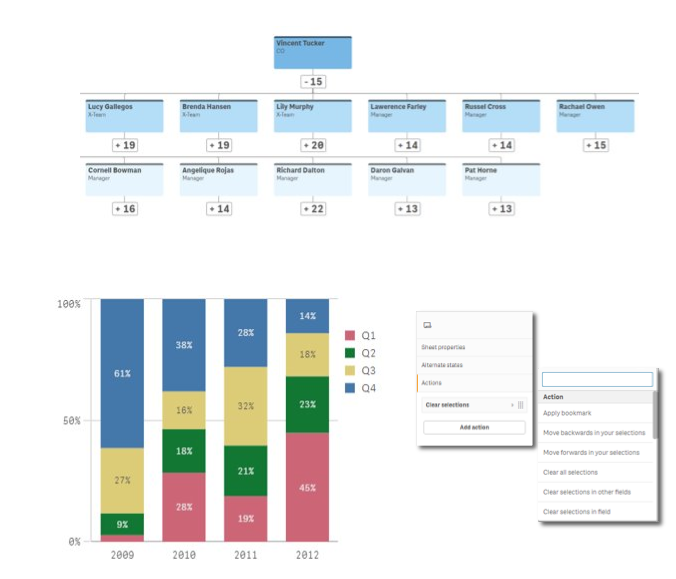
To further enhance the user experience with Qlik Sense, the platform was also equipped with several new visualization and dashboarding capabilities in the April release. The new version includes, among other things, an organizational chart to display maps in a hierarchical structure, relative modifiers to simply display the percentage of total in a measure and new “sheet triggers” that allow certain actions to be added to a worksheet, which are triggered when the sheet is opened.
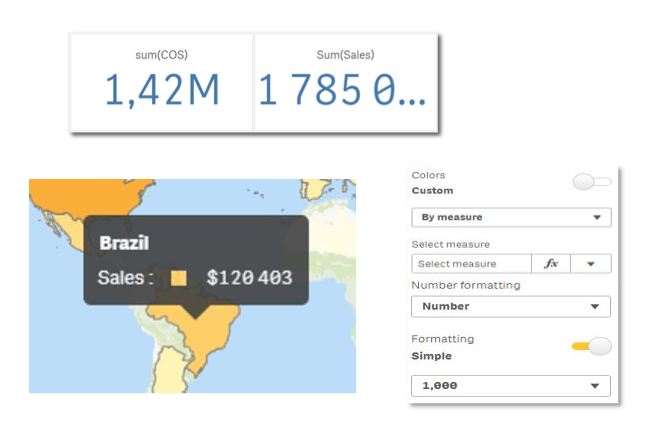
Qlik Sense April 2020 has also been enhanced with new KPI font options (fixed, fluid and responsive), new map chart formatting options for color and size by measure, increased limit of items (50.000) on point and area map layers and the option to exclude Qlik logos on maps and default measures in custom tooltips.
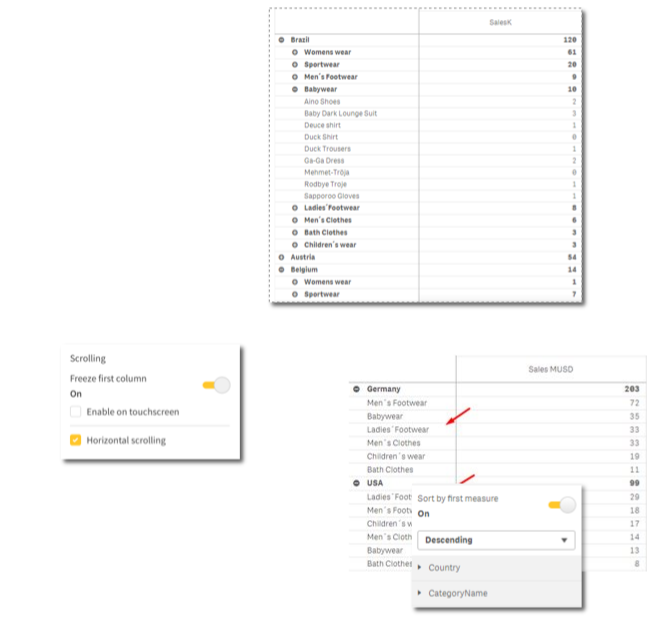
Pivot tables now also offer the ability to save the current layout state, sort by the first measure and freeze the first column.
Further optimizations – also in Qlik NPrinting
The new release also includes improved navigation for greater ease of use, more connectors and new ways to share and manage content across the data analytics platform.
The NPrinting reporting platform was also enhanced with new functionality with the April releases. This allows emails generated from publishing tasks to be sent to dynamic recipient lists (via TO-, CC- and BCC-field). The corresponding recipient lists can be created directly in NPrinting as new fields or dragged from Qlik variables. An overview of the most important new features and innovations in the Qlik April 2020 releases can be found in the following video:
With your click the video is loaded on YouTube. Please note that data is transmitted to YouTube. Please also note our privacy policy.