With the release of its June versions, BI vendor Qlik has once again made new features and enhancements available for several of its products. The data visualization platform Qlik Sense was also equipped with new visualization options.
With the introduction of a new business logic into the cognitive engine, Qlik has also revised the Augmented Intelligence area. The new feature helps users to create rule sets and metadata, which in turn serve as a basis for the Insight Advisor to generate visualizations and insights. The Insight Advisor now also supports additional languages for search-based insight generation: French, Spanish and Russian.
To enhance its cloud offering, Qlik has also optimized connectivity with the new release wave. To this end, additional data sources (e.g. Qualtrics) and additional connectors in the Qlik Sense Add-Data screen (e.g. Google Analytics and Twitter) were made available and existing connectors were optimized.
New features for visualizations and dashboards
In order to be able to cover as many of its users’ requirements as possible, Qlik also attaches great importance to expanding the visualization and dashboarding options in Qlik Sense with each new release. More than 50 options are now available and are constantly being expanded.
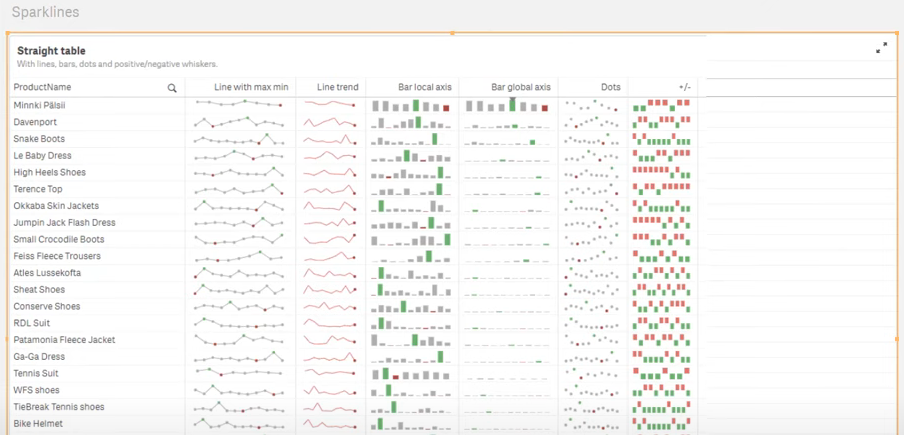
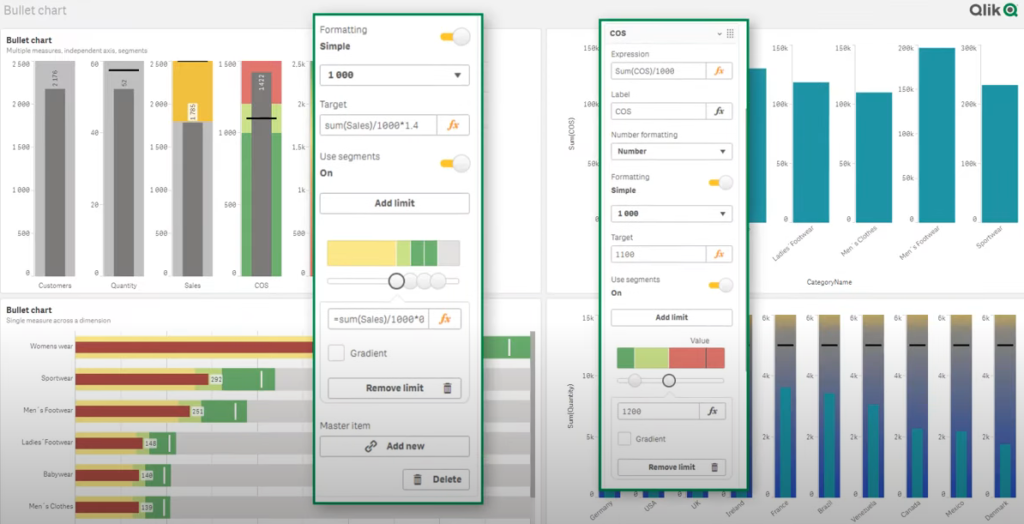
Mini diagrams, also called “sparklines”, can now be inserted into cells of straight tables. For a better user experience, Qlik Sense June 2020 also offers new options for table customization (e.g. flexible scrollbar size settings). There have also been made enhancements to the bullet chart with new formatting options, to the recently introduced organization chart (including a home button and auto zoom), and to the number formatting and the filter area.


The custom tooltips have also been improved. Enhancements include support for line charts, the ability to hide default lines and the availability of additional information in all charts.
Further improvements in development, data integration and NPrinting
In addition to the new features listed above, the June releases include “Qlik.dev”, a new developer portal for discovering, learning and referencing APIs for the Qlik platform, and the integration of the Qlik library “Nebjula.js 1.0”, which makes it easier to embed Qlik analyses in other web applications. In addition, updates were provided for several data integration products.
Users of the reporting platform NPrinting can now benefit from enhanced NewsStand functionality and the ability to customize visualizations with Qlik Sense theme. As always, the following YouTube video provides an overview of the most important new features of the Qlik June 2020 releases:
With your click the video is loaded on YouTube. Please note that data is transmitted to YouTube. Please also note our privacy policy.
