Qlik has rolled out the September releases for its products. The data visualization platform Qlik Sense was also equipped with some new features and improvements.
In addition to new visualization options, the area of Augmented Intelligence, the APIs, the Hub and the SaaS capacities were also expanded. Highlights of Qlik Sense September 2020 include:
Improved Augmented Intelligence
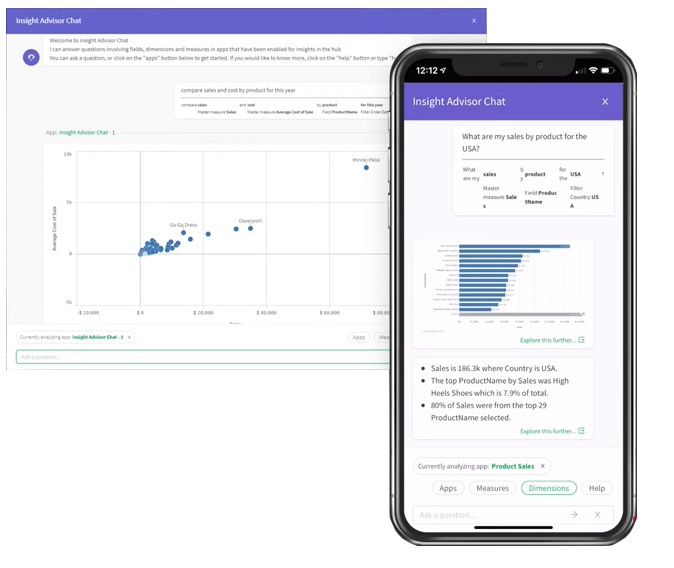
With the new Insight Advisor Chat, the new version of Qlik Sense offers users a fully conversational, natural language-based analysis experience. The multilingual Natural Language Processing (NLP) interprets the user’s intentions and now provides additional insights (e.g. automatically generated diagrams, narrative insights and observations) via Natural Language Generation (NLG).

Thanks to optimized business logic, the behavior of the Insight Advisor can now be better adapted and controlled during insight generation and user interaction using rules and metadata. For example, fields can be logically grouped, data classified and preferred relationships defined.
The Insight Advisor also offers new search-based diagram types. These include the Cluster Chart (using the new “K-Means Clustering” function), the Correlation Chart and the Control Chart.
The September version also includes enhancements to the analytics calculations in the associative Qlik engine. The first available function in this area is the so-called “K-Means-Clustering”. This enables the grouping of data points based on the similarity to clusters and can be used for use cases such as customer segmentation or fraud detection.
More SaaS Capacity
In Qlik Sense September 2020, the maximum size of in-memory apps (including existing ones) has been doubled to 5GB. This gives users the ability to analyze even larger data sets. The limits for reloads and total memory have also been removed.
Optimized visualization options
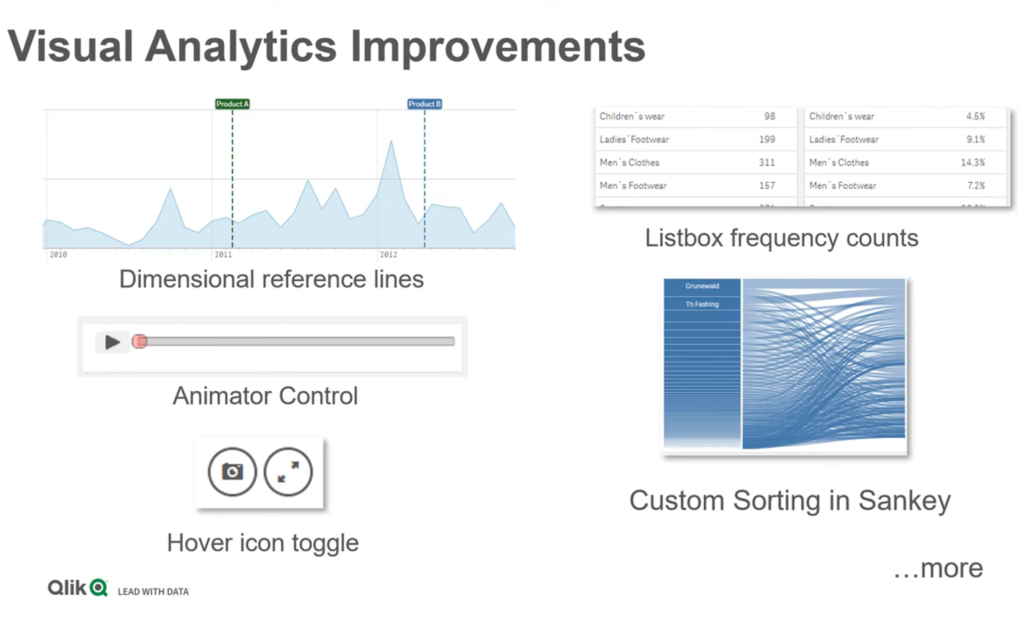
The visualization options have also been expanded again with the new Qlik Sense version. For example, bar and line charts are now equipped with dimension-based vertical reference lines with formatted labels. These can be used to provide charts along a time axis with additional information (e.g. start or end date of important events).
With the new “Animator” control, data that changes over time can be animated. In this way, values in each dimension (with or without aggregation) are automatically selected and played in a loop.
In addition, the new release contains other minor improvements for charts, such as the ability to format numbers in master measures, turning on and off borders in containers, frequency counts in the filter pane and a custom sorting in the Sankey Chart.

Extensions in the API and Hub area
In addition to the new features and improvements listed above, Qlik Sense September 2020 includes other new features such as support for first open source libraries, including enigma.js and nebula.js, and the ability for users to now manage data files and connections in Managed Spaces.
As always, the following video provides an overview of the highlights of Qlik Sense September 2020.
With your click the video is loaded on YouTube. Please note that data is transmitted to YouTube. Please also note our privacy policy.
