With the release of this years November version of Qlik Sense, the data visualization platform has been optimized and expanded in various areas once again.
In addition to an improvement of the business logic, the K-Means clustering and the Insight Advisor, new features and options regarding visualizations and usability, are now available for the user. A new modern Qlik Sense Theme with attractive design options in color and font selection also provides a fresh look.
Enhancements in Analytics
As with the September release, the business logic in Qlik Sense has been optimized. Using rules and metadata, the behavior of the Insight Advisor during insight generation and user interaction could already be adjusted and controlled as before. For example, fields can be logically grouped, data classified and preferred relationships defined. The processing of natural language can now also be adapted, for example by defining vocabulary rules and synonyms for more natural interaction.
The September version introduced K-Means clustering into the Qlik engine, which allows cluster-like data points to be grouped. With the new release, the K-Means functions now also support automatic clustering. This calculates an optimal number of clusters for each data set when a user sets the cluster number to zero.
A new functionality has also been added to the Insight Advisor. It now offers alternative visualization options for results from search-based analyses and ensures that the data is displayed as efficiently and meaningfully as possible. In addition, more chart types are now available for selection.
Improved visualization and usability
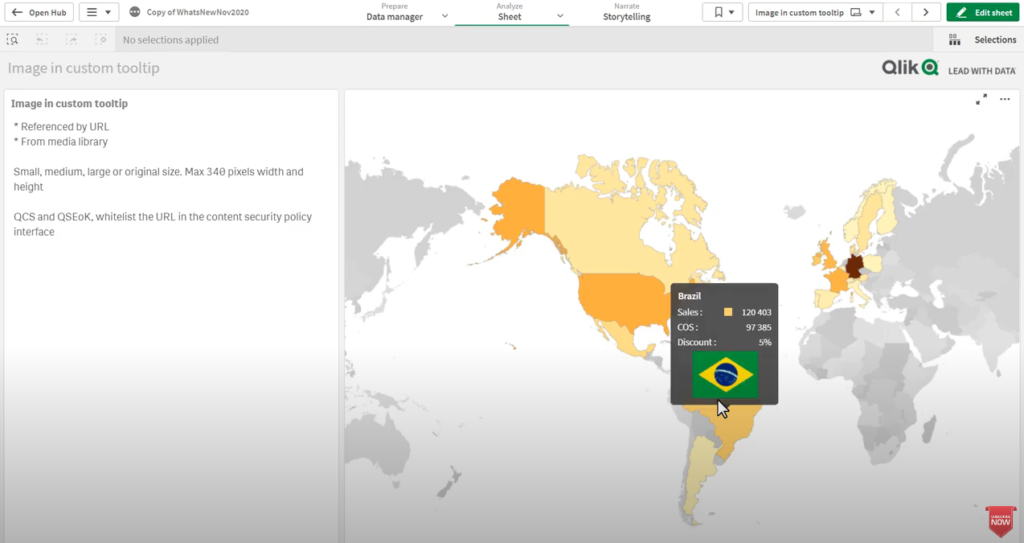
Qlik Sense November 2020 offers the ability to add custom images to tooltips. For this purpose, an image from the media library can be displayed or linked via a corresponding URL. The new feature supports app development by providing additional context.

Furthermore, sheets can now be copied between different apps, which improves the productivity of developers and power users. Measures can also be copied between two objects. Both features enable a faster generation of insights and been requested by users for a long time.

Qlik Sense November 2020 also contains some helpful new and improved features for charts in the visualization area. Besides the ability to show and hide disclaimers in charts, the waterfall diagram now supports 50 instead of 15 measures. The functionality in table mini charts has also been enhanced.
An overview of the highlights of Qlik Sense November 2020 can be watched in the following video:
With your click the video is loaded on YouTube. Please note that data is transmitted to YouTube. Please also note our privacy policy.
