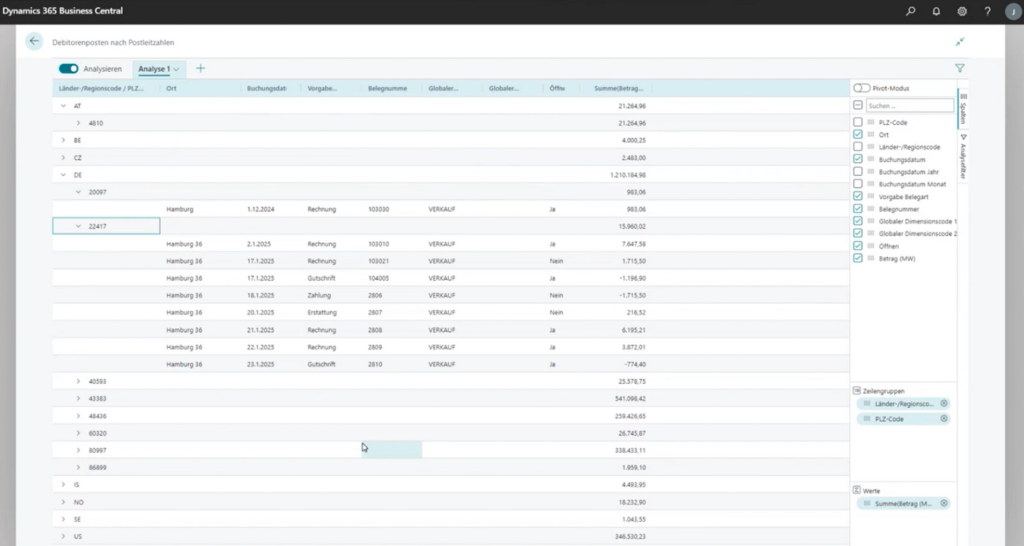
With the current Business Central version, the options for data analysis have also been optimized again by expanding the new analysis mode.
In the recent past, Business Central has broken up its previous structure in the analysis area and added far more dynamic analysis views to its previously rigid and inflexible analytical reports. The recently introduced new analysis mode has been extended again with the current version.
Analyze, group and pivot query data
With the latest Business Central version, data from queries can now be analyzed directly in the client without having to open the page in Excel or run a report. In this way, in addition to the established analysis options via reports, Excel or financial reports (formerly account schedules), a further feature is available for data analysis, which can be used without having to switch between applications.
The analysis mode was already introduced in a preview version as a new option for interacting with data on list pages with the first release cycle in 2023. Instead of running reports with different options and filters, you can easily add multiple tabs that reflect different tasks or views (e.g. “My customers”, “Follow-up items”, “Recently added vendors”, “Sales statistics”) of the data.
Business Central 2023 Wave 2 now also makes it possible to analyze data from any queries, just like on a list page. Data from several tables can be merged using a query object. For example, data on sales orders can be combined with additional information about the customer or the salesperson involved.

The respective queries can then be inserted as actions on pages using the RunObject property. The data is evaluated in real time – always taking into account the data security set up for the respective user.
For more extensive and complex evaluations, the use of a modern and dynamic data analysis tool such as Qlik Sense is still recommended.
