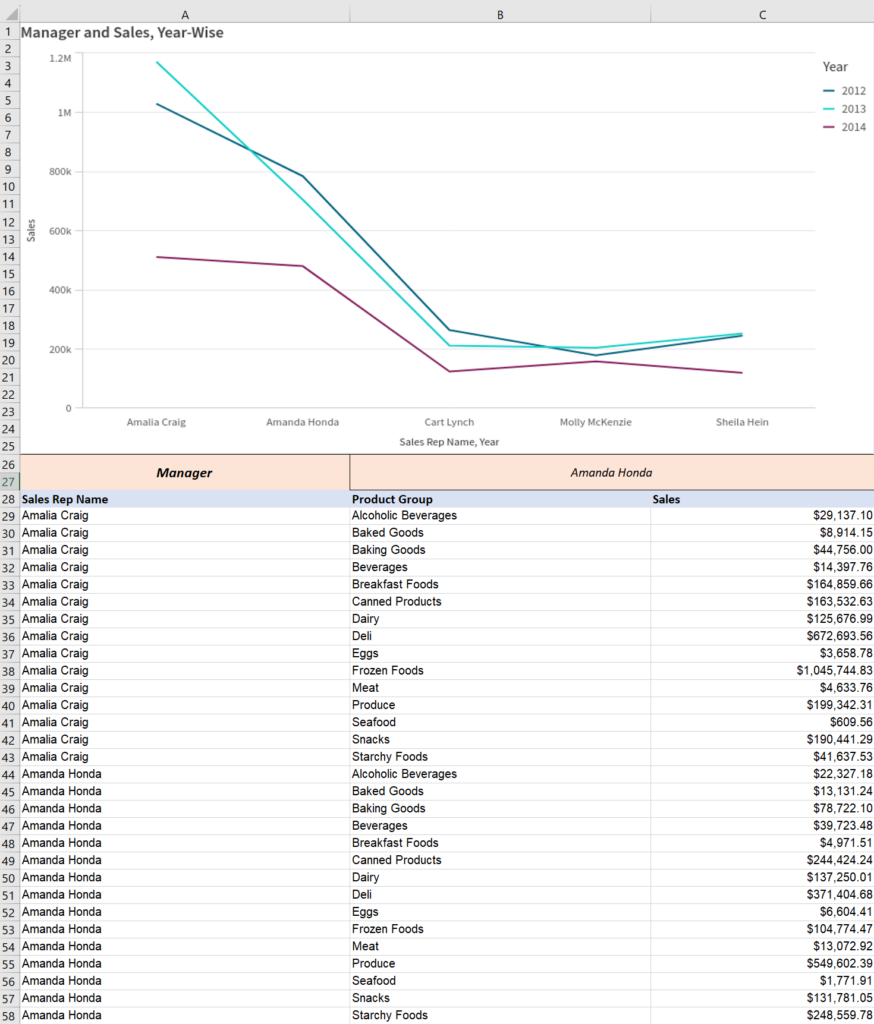
BI provider Qlik recently released Qlik Cloud Tabular Reporting, the long-awaited ability to create Excel reports.
With the new Tabular Reporting, common, centrally managed, tabular report distribution requirements can now be fulfilled within a Qlik Sense application. This means that custom and highly formatted Excel documents can now be created from Qlik data and visualizations. The functionality is realized via an Excel add-in in order to be able to access the desired apps and objects directly from there. Finally, the reports can be distributed as required via governed report tasks.

To create the dynamic tabular reports, the Qlik add-in for Microsoft Excel must be combined with the report preparation features in the respective Qlik Sense app. The report output can then be sent by e-mail and to folders defined in Microsoft SharePoint connections.
The tabular reports can be managed in Qlik Cloud in the “Reporting” section of the “Prepare” tab in the Qlik Sense app. Report jobs are created and organized via report tasks. The data reduction is controlled via corresponding report filters. Recipients and linked groups with multiple recipients are finally available in a distribution list.
The reports can be created in .xlsx format or, more recently, in PDF format. This can be configured in the report task. The Qlik add-in for Microsoft Excel can also be used to display a preview of the report output in PDF file format. The new PDF configuration extends the possibilities of tabular reports and supports the creation and distribution of multi-page, highly formatted and read-only (PDF) reports. It is also possible to increase the resolution of the stored images.
