BI vendor Qlik has published its new release for Qlik Sense on Windows. Qlik Sense August 2022 has again been enhanced, particularly in the areas of Augmented Analytics and visualization.
The August release is the third client-managed version this year and includes, among other things, a new scripting option at chart level, a styling panel for bar and pie charts and innovations in the connectors area. Some of the optimizations were available in advance for Qlik Sense SaaS again.
Innovation in Augmented Analytics
Qlik Sense August 2022 provides a helpful functionality with new chart level scripting to modify the dynamic dataset behind a chart using a subset of the Qlik scripting language and techniques such as variables and loops. This can be done by adding and changing rows and columns that are not in the original dataset. In this way, calculations that were impossible before can be made in chart expressions (e.g. simulations or goal-seeking).
Optimized visualizations and dashboards
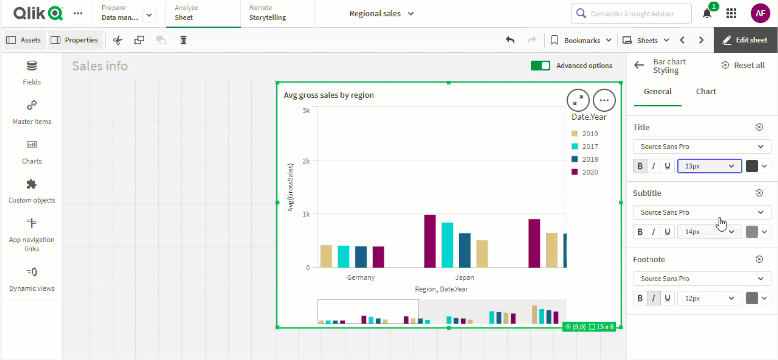
To improve customize visualizations, the new Qlik Sense version allows users to select the font style for titles, subtitles and footnotes in bar and pie charts. The new “General” tab lets users set the font style, size, color and emphasis. The “Chart” tab, on the other hand, controls the layout of bars in bar charts and slices in pie charts.
In addition, new chart and script functions have been introduced that support JSON data testing, validation and modification (IsJson, JsonGet, JsonSet).

Extension of connectors
To support access to Microsoft SharePoint lists and views, the Office 365 SharePoint Metadata connector has been updated with the new release. “Views” and “ItemsFromList” tables can now be loaded in the Data manager or Data load editor.
Qlik Sense on Windows also now includes Qlik Web Connectors to GitHub, Google Analytics, Jira and Twitter – just like Qlik Sense SaaS – without having to install them separately.
